Comp AISponsored
Get SOC2, ISO 27001 or HIPAA compliant in 4 weeks. Get started instantly, no sales calls, no upfront contracts.

Grafana is an open-source, composable observability and data visualization platform that allows you to query, visualize, and alert on metrics, logs, and traces from multiple data sources. It integrates seamlessly with a wide array of backends like Prometheus, Loki, Elasticsearch, InfluxDB, and Postgres, among others, enabling a unified view of your entire stack.
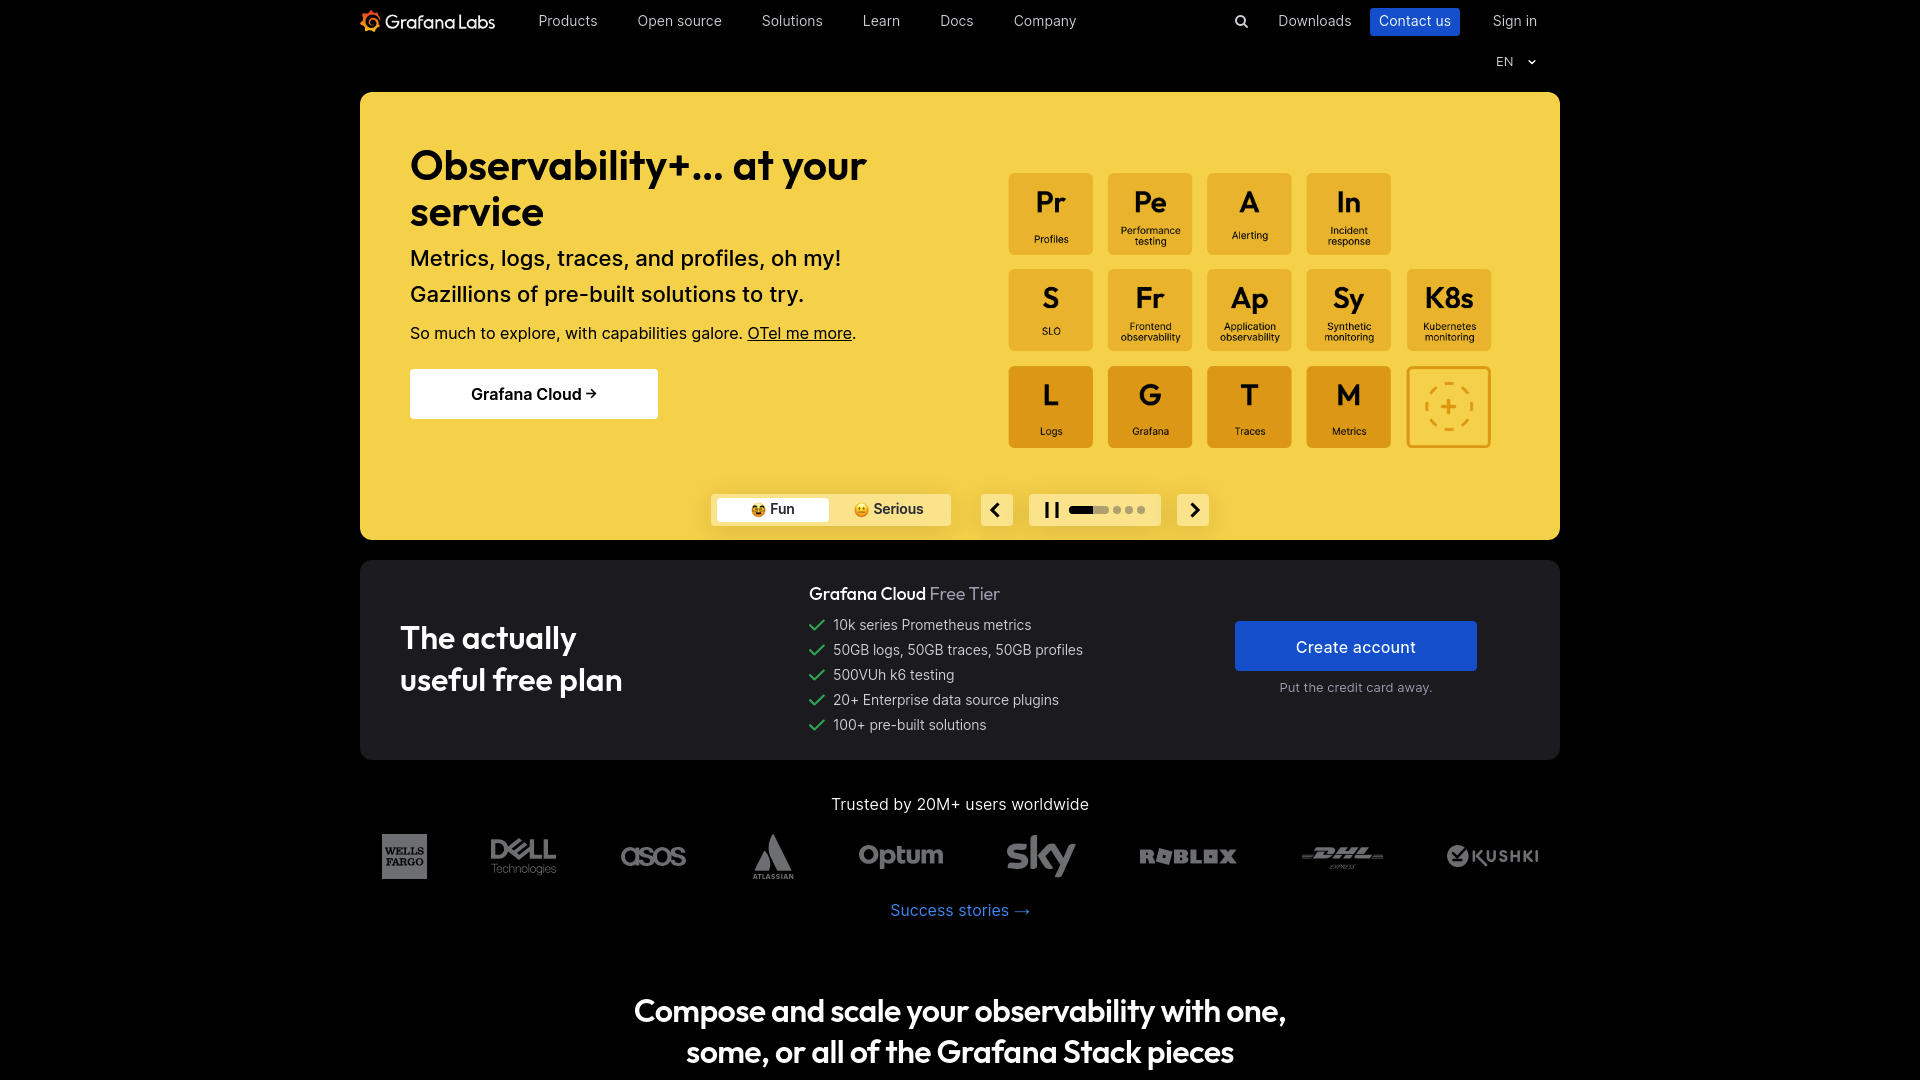
- Metrics Visualization: Query and visualize metrics from sources like Prometheus and Graphite.
- Log Aggregation: Aggregate and search logs with Grafana Loki.
- Tracing: Distributed tracing with Grafana Tempo.
- Dashboarding: Create and share customizable dashboards.
- Alerting: Set up and manage alerts to stay ahead of issues.
- Plugins: Extend Grafana’s capabilities with a wide variety of plugins.
- Synthetic Monitoring: Monitor API and web application performance.
- Continuous Profiling: Profile application performance with Grafana Pyroscope.
- Incident Management: Manage incidents with Grafana OnCall and Grafana Incident.
- Frontend Observability: Gain insights into frontend performance with Grafana Faro.
Grafana’s flexibility and wide range of integrations make it an indispensable tool for modern observability, catering to both small teams and large enterprises.